|
Saving and Opening Graphs |
PaperScope allows you to save
a graph you have built for later use or distribution to others.
This way you are able to add comments to papers, build graphs of
relevant papers for a project, and share these with
collaborators. A saved graphs contains more than the paper
information and link information. It can also save a graph
layout (the location of the nodes) and visibility information.
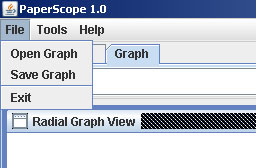
To save a graph simply click
on the 'File' menu at the top left and select 'Save Graph'.

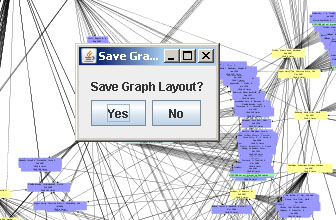
You will immediately be asked
whether or not you want to save the graph layout. If you
click the 'Yes' button then the locations of all the nodes will
be saved, and the next time you open this graph you can load the
layout.

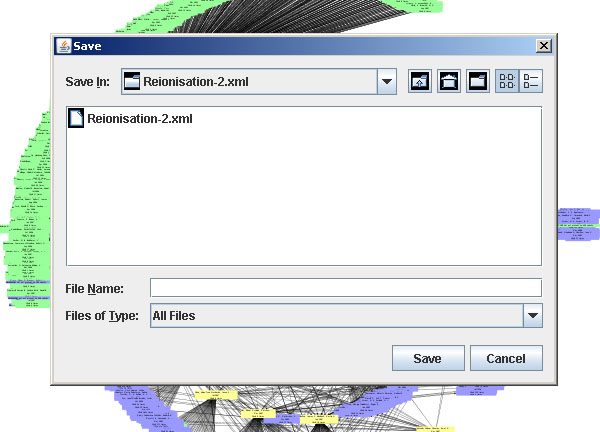
Next you can use the file chooser to navigate to
the folder where you want to save the file and choose the file
name. If you don not add the ".xml" extension to the file
then it will be added automatically.

To open a graph simply click
on the 'File' menu at the top left and select 'Open Graph'.

Use the file chooser to navigate to the folder
where you have the graph file, select it, and click the 'Open'
button. The graph will open and display automatically in
the 'Graph' tab. Note that for large graphs the nodes may
appear to be cluttered at this point. To fix this simply
zoom out and click on a node to re-center the graph, or if you
previously saved a graph layout then you can load it now.
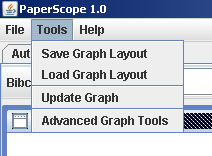
Simply click on the 'Tools' menu in the top left and select the
'Load Graph Layout' option.

The graph will now adjust and the nodes will be
placed at the location where you last saved the layout.
NOTE: If you cannot see the
graph then trying zooming out and looking around to find it.
The initial view point may not be centered on the location where
you had saved the layout.
NOTE: If no layout
had been saved previously then all the nodes will go to the same
point and will overlap. To fix this look for the pile of
nodes and click on one, and the graph will adjust itself.