Now that you have the program
running, how do you use it? This page provides a simple
walkthrough with screenshots to show you how to use the
different tools PaperScope provides. It will quickly touch
on most of the important features and explain their purpose.
For a more detailed description of the different tools and how
to use the graph go to Using the Graph.
When you open PaperScope you are presented
with the following (the bottom has been cut off for clarity):

From here you can begin your search two ways, by searching for
papers by author or keyword, or by clicking on the 'Graph' tab
and entering a paper's bibcode. For this walkthrough we
will will begin our search by performing an author search on
Stephen Hawking. To do this type
Stephen Hawking into the 'Author Name'
text field and click the 'Submit' button (or hit enter).
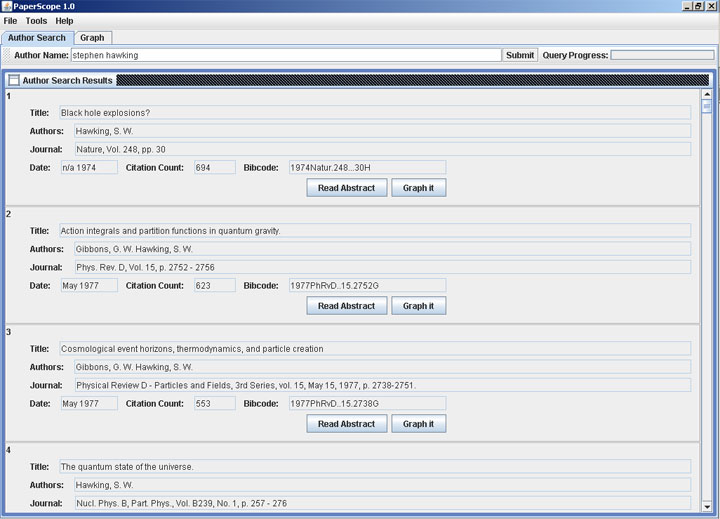
PaperScope runs this query on the ADS and
returns a list of the top 100 results for the search term
provided. Each paper is listed with its title, authors,
journal, publication date, citation count, and bibcode.
Each paper also is listed with two buttons, one for opening the
paper's abstract in your browser, and another for starting a
graph for this paper.
For this walkthrough we will scroll down the
list to the 15th paper, titled "Open inflation, the four form
and the cosmological constant", and click the 'Graph it' button
(the order of results may change, if you do not see the paper
there simply click on the 'Graph' tab, type this bibcode into
the text field - 1998PhLB..432..271T - and hit enter).
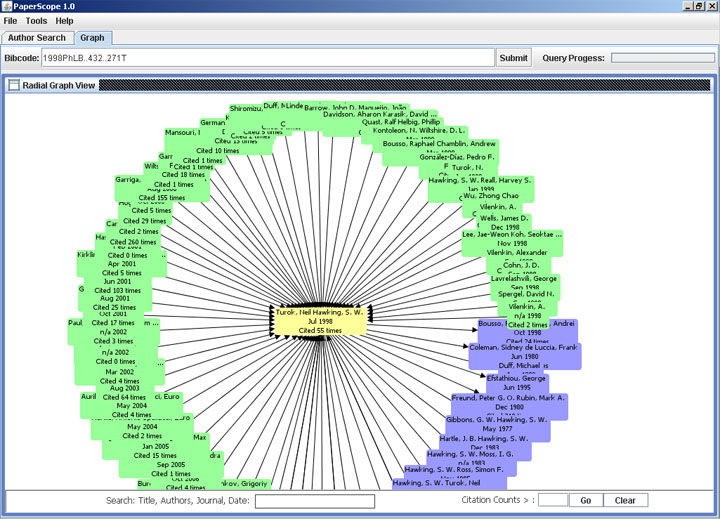
The 'Graph' tab is automatically opened, and the 'Query
Progress' bar will indicate that the query is running.
When the query completes the graph will be displayed, and it
should look like the image above.
The paper we started the graph with is called a "focus" paper,
and is the yellow one in the middle. The blue nodes
represent papers referenced by our focus paper, and the green
nodes represent papers that cite our focus paper. Notice
that the links between the papers have arrows, and these arrows
indicate the direction of reference (the arrow points to the
paper being referenced). Each node lists the paper's first
two authors, the publication date, and the citation count.
Many of the nodes are overlapping and making the graph hard to
read, so the easiest way to fix this is to zoom out and re-center
the graph. To do this hold your mouse cursor over an empty
part of the graph and click and hold the right mouse button, and
gently push the mouse away from you (up). The graph should
appear to move away from you. Once you zoomed out a little
ways left click on one of the peripheral nodes.
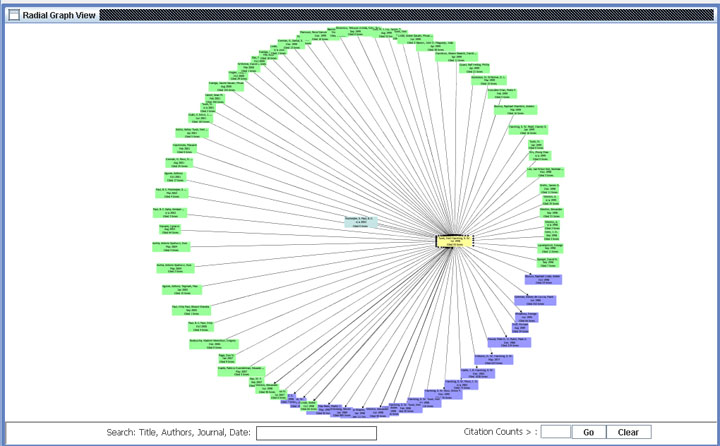
Notice how the graph has shifted and the node you clicked on is
now at the center (it has also changed color). The outer
nodes have spread apart and are now easier to read. If you
want to zoom back in simply right click and hold on an empty
part of the graph and pull the mouse towards you (down).
In order to move the graph around and look at different parts
left click and hold on an empty part of the graph and
move your mouse. The graph will move accordingly.
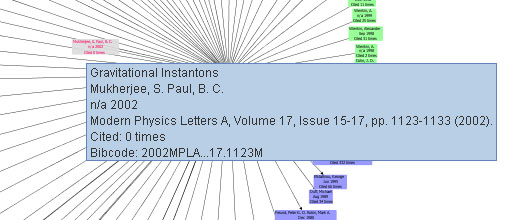
In order to see the complete information about a paper there are
two options. First you can simply hold your mouse cursor
over a node, and the paper's information will pop up (see
below). The node will change color to grey as your cursor
over it, and change back once your mouse moves away. The
paper's information will display for a few seconds and then
disappear.
The second way to view the paper's information involves using
the special node menu. To do this simply right click on a
node and a menu of options will appear:
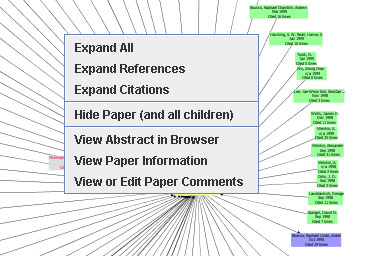
This menu provides you with a number of important tools and will
be used often. For now simply click on the 'View Paper
Information' option, which will open a window displaying the
paper's main information:
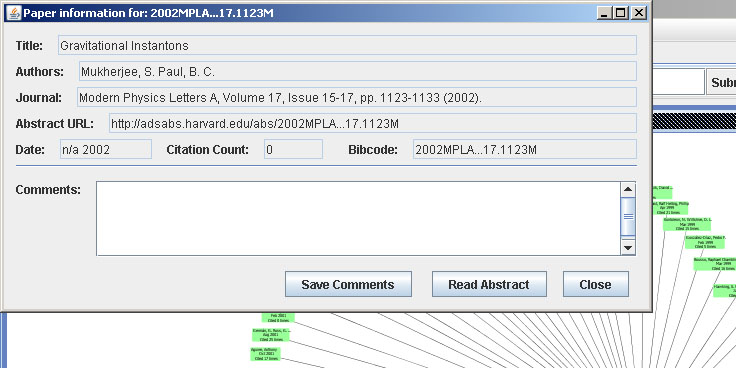
Here you can find all the main information about a paper, and
you have buttons for adding comments or reading the abstract.
Clicking the 'Read Abstract' button will open the paper's
abstract in your browser. If you type comments into the
text box and click the 'Save Comments' button it will save these
comments, which will be useful later when saving a graph.
Try typing in a comment, and Click the "Save Comments' button.
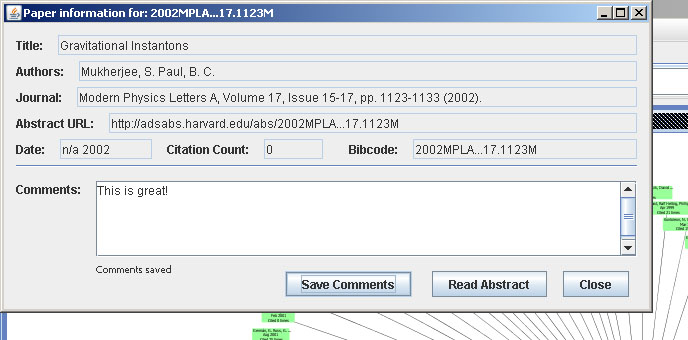
A note will appear telling you that the comment has been saved.
Now click on the 'Close' button.
Now if you look at the node you just added the comments to you
will notice that the text color on the node has changed to red.
This is done to highlight nodes with comments, so all nodes that
have user comments are displayed with red text (for more on the
Node Color Scheme
click here).
Now lets say we are interested in papers on the "Cosmological
Constant", and we want to see if there are any on this graph.
Simply go to the "Search" box on the bottom of the graph view
and type "Cosmological AND Constant" into the box. Notice
that a number of the nodes have turned pink, and the 'Search'
box says that there are 10 matches.

All papers that have the words "Cosmological" and "Constant" in
their title are highlighted in pink. The 'Search' box
allows you to search the entire graph in real time and will use
boolean operators that are written in all capitals (AND, OR,
NOT). It searches the title, authors, journal, and
publication date fields. It is an extremely useful tool
for locating papers of interest.
Now lets say we are only interested in well cited papers about
the Cosmological Constant, say papers with more than 100
citations. So we type "100" into the "Citation Counts >"
box and click the 'Go' button. All papers with more than
100 citations are indicated by nodes with red borders.
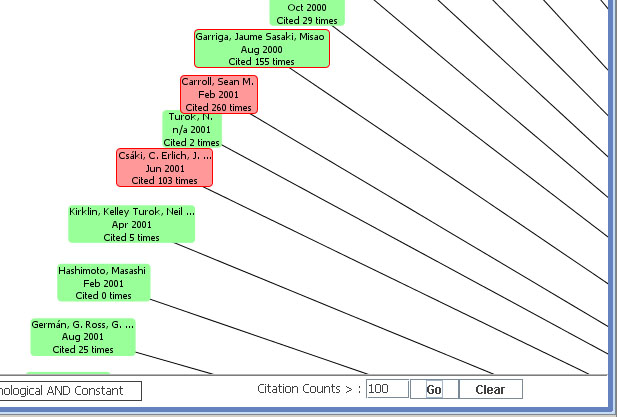
Now that we have identified a number of papers about the
Cosmological Constant that have more than 100 citations let's
see how they are related to the other papers already on the
graph.
To do this simply right click on a node (in this case one that
is pink and has a red border, for this walkthrough we've used
the paper with bibcode 2001LRR.....4....1C), and select the
"Expand All" option from the menu. This paper is now
considered a "focus" paper on the graph. You will
notice that the graph will zoom out, and the 'Query Progress'
bar will start running. What PaperScope is doing is
querying the ADS for the reference and citation lists for the
paper you just expanded, and checking these lists against the
papers already on the graph. Any papers that they have in
common will now have two links, one to each focus node, showing
references/citations that the two focus papers have in common.
Any papers that weren't already on the graph are simply added
with a link to the focus paper you just expanded.
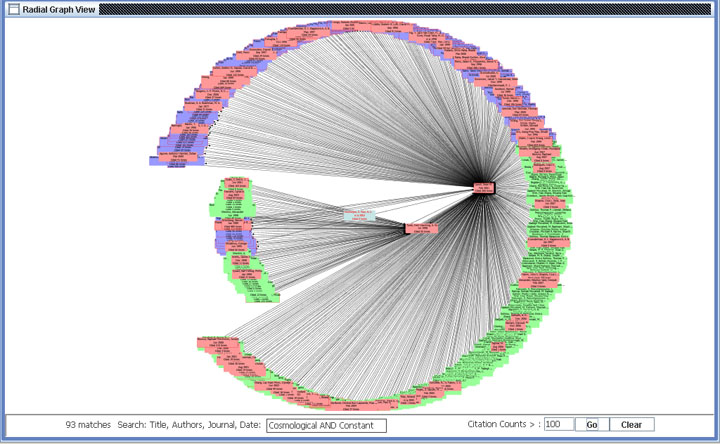
You will also notice that a number of the new nodes are already
highlighted in pink, and some have red borders. This is
because the search terms and the citation count highlight are
automatically run when the nodes are added so that papers of
interest are immediately highlighted. Clearing the
'Search' box will return all the nodes to their original color,
and pressing the 'Clear' button by the 'Citation Count>' box
will clear the citation count highlighting.
Since the paper we expanded has a large number of references,
and is cited by a large number of papers as well, the graph has
become hard to read. In order to fix this try zooming out
and left clicking on a different node to spread things out more.
In this case it is still hard to distinguish papers so it is
time to use some of the advanced tools provided for hiding
papers we are not interested in.
Click on the 'Tools' menu at the top of the screen, and select
'Advanced Graph Tools'.
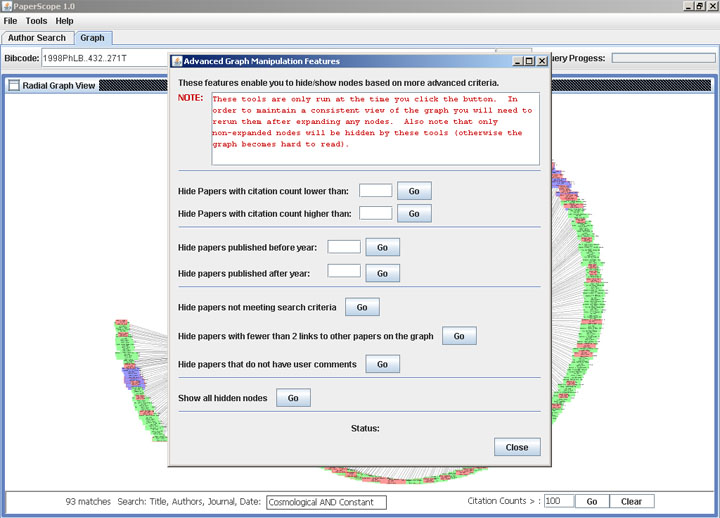
This window provides you with a number of tools for hiding and
revealing nodes based on more advanced criteria. It is
important to note that these tools only run when you click the
button, and are not run automatically when expanding the graph
later like the 'Search' box or the citation count highlighting.
For now lets hide any papers not about the
Cosmological Constant. Click on the 'Go' button next to
the option labelled 'Hide papers not meeting search criteria'.
You will notice that the 'Status' in the lower right now says
"Done". Click the 'Close' button and now look at the graph:
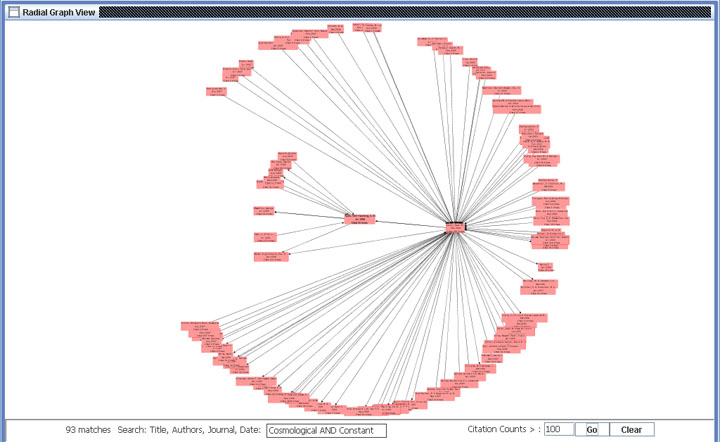
Now all the visible papers are about the
Cosmological Constant. Notice that they are all
highlighted in pink since they all meet the search criteria in
the 'Search' box.
Let's get even more specific now and look
only at papers about the Cosmological Constant and Gravity.
Add the phrase "AND gravity" to the end of the text in the
'Search' box.
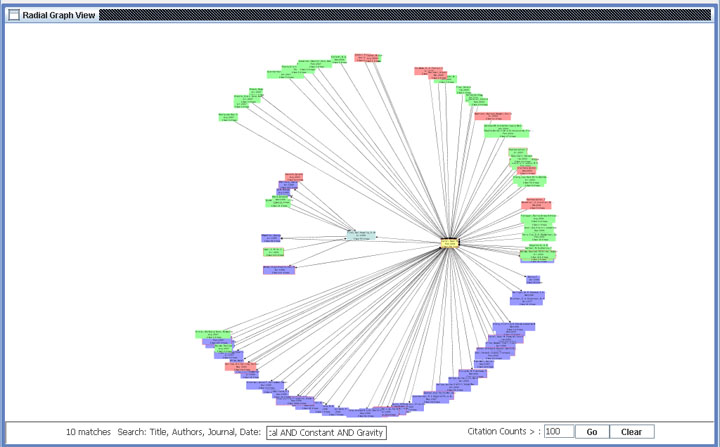
Now we've limited it down to 10 papers of
interest. Let's see if any of them are related (i.e.
reference each other, or share common references/citation
papers). Use the 'Citation Count >' box to highlight only
those with more than 10 citations. Now expand all the
nodes that are pink with a red border (there should be five of
them) (remember to zoom out a little each time after clicking
the "Expand All" option so the graph has extra space to fill
in).
You will notice that a number of links appear
to be pointing at invisible nodes. This is because these
nodes were hidden earlier when we hid all papers that didn't
meet our search criteria. To fix this clear out the text
in the 'Search' box and replace it with "Cosmological AND
Constant" (our original search term). Now click on the
'Tools' menu, select 'Advanced Graph Tools' and click on the
button for 'Show all hidden nodes'. Now that all the nodes
are displayed rerun the search filter by clicking on the button
for 'Hide papers not meeting search criteria'. Now click
the 'Close' button. You will notice that all the links to
invisible nodes are now gone.
After all five nodes have been expanded, and
you've rerun the 'Advanced Graph Tools' as specified above, your
graph should look something like this (not identical, but the
visible nodes and links will be the same):
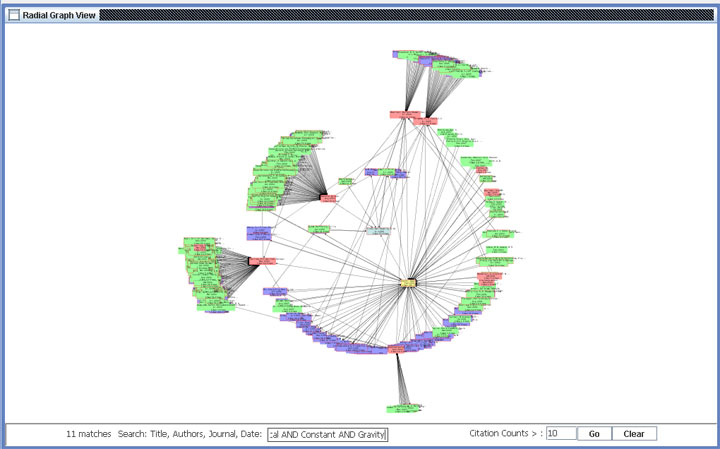
Notice all the different cross links between
the papers that are now visible. To make these
relationships clearer let's use one of the graph tools to hide
any peripheral nodes. Click on the 'Tools' menu, select
'Advanced Graph Tools', and click on the 'Go' button for the
option labelled 'Hide papers with fewer than 2 links to other
papers on the graph'. Now click the 'Close' button.
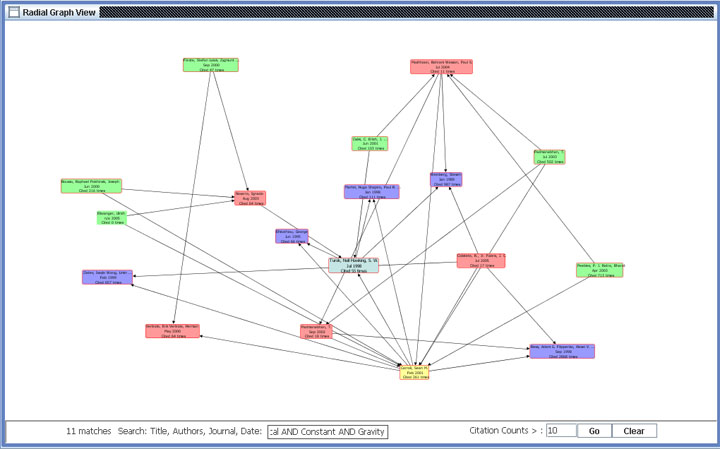
Notice that all nodes with only one link are
now invisible. It is also now easy to see the
relationships between all the different papers on the graph.
Clear the text out of the 'Search' box and try moving the nodes
around to get a clearer picture of how the papers relate to one
another. Once you've reached a layout you like click on
the 'Tools' menu and select 'Save Graph Layout'. A frame
will pop up telling you the layout has been saved. Now you
can return the graph to this specific layout later by clicking
the 'Load Graph Layout' option from the 'Tools' menu. To
see how this works try clicking on any of the nodes to force the
graph to re-center. Once you have done this click on the
'Tools' menu and select the 'Load Graph Layout' option.
You will notice that the nodes in the graph snap back into the
locations you saved.
Looking at the graph we've created you can
now clearly make out which papers our focus papers share as
references, and which papers cite several of our focus papers.
Using the tools PaperScope provides had allowed us to identify
these papers in a relatively quick and painless way.
Without these tools the task could only be accomplished by
querying for each focus paper's reference and citation lists and
then scanning them by hand to cross compare their contents.
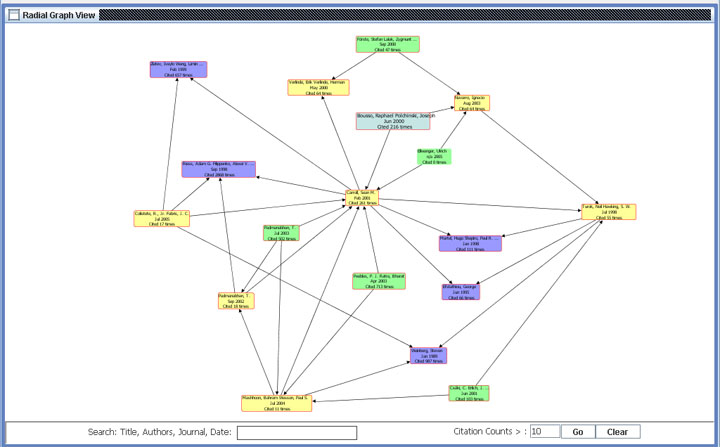
Once you have constructed a graph like this
that you would like to refer to in the future, or share with a
collaborator, you can save the graph. Simply click on the
'File' menu for the 'Save Graph' and 'Load Graph' options.
Now that we've walked through the basic tools that PaperScope
has to offer you should be able to begin using it in earnest for
finding papers of interest. By expanding the graph and
using the search tools you can easily locate papers of
importance based on a range of criteria, and you can then save a
graph for referral later. You can also share your graph
file with others, allowing them to read your comments on papers
and see which ones you feel are the most important.
Good luck!
back to top